|
Rainfall data is based on weekly totals.
17.715 inches total rainfall this year. Updated 6/20/2026 | |
 Personal Weather Station on Weather Underground Personal Weather Station on Weather Underground |
|
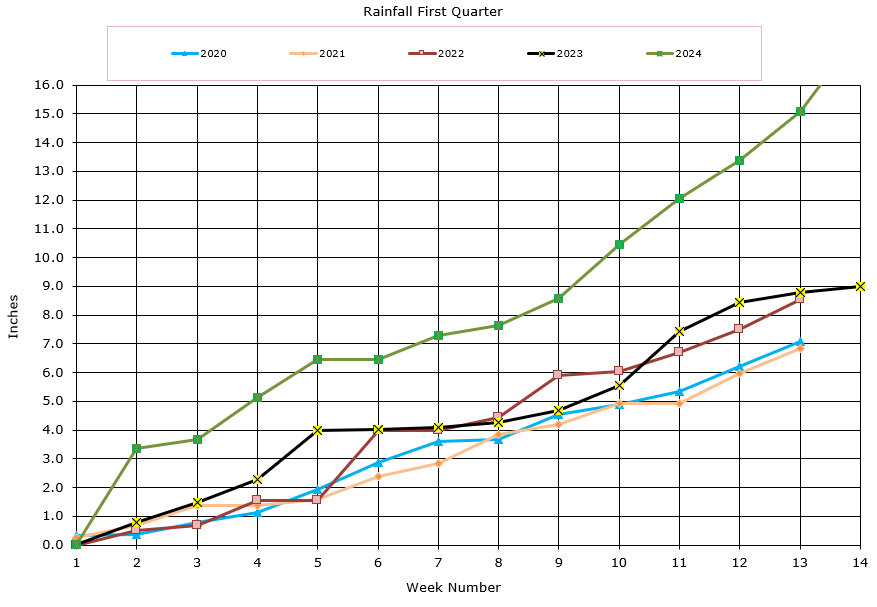 First Quarter Chart First Quarter Chart |
| LOCAL RAINFALL |
|
Rainfall data is based on weekly totals.
17.715 inches total rainfall this year. Updated 6/20/2026 | |
| Personal Weather Station on Weather Underground |
|
| First Quarter Chart |
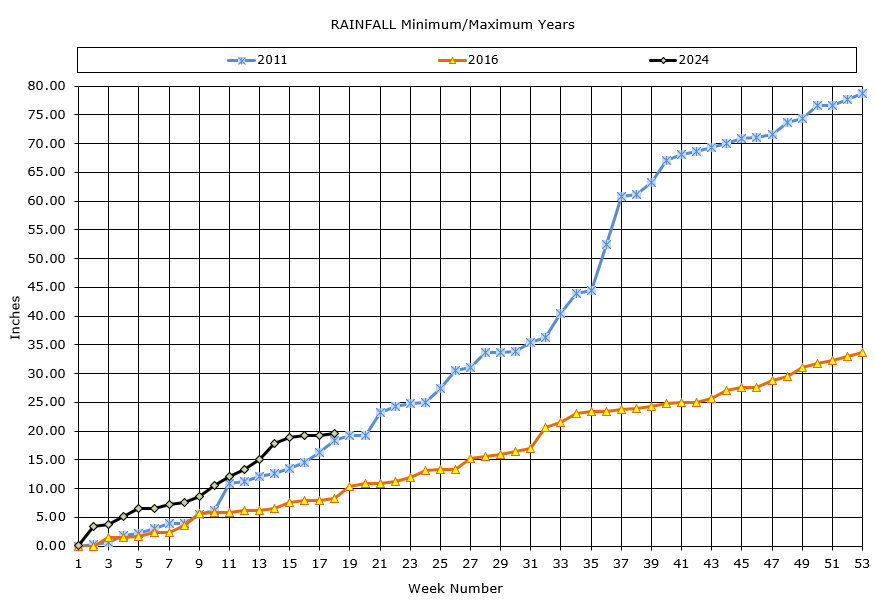
| RAINFALL CHART |
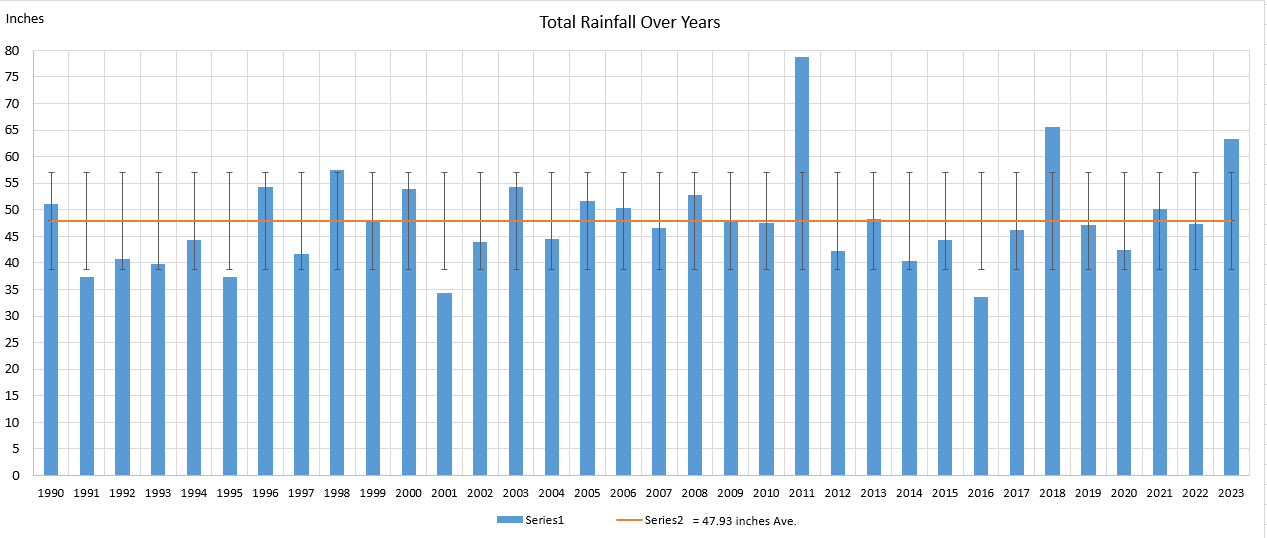
| PAST YEAR TOTALS |
| End Date | Rainfall (in.) | Comment |
|---|---|---|
| Dec 31, 2025 | 41.83 | Started wet in spring leading into no autumn storms. Below average rainfall year. |
| Dec 31, 2024 | 51.11 | Started very wet then a long dry stretch, with complaints of drought. |
| Dec 31, 2023 | 63.32 | Started dry then wetter, with some local severe flooding. |
| Dec 31, 2022 | 47.32 | Started very wet then very dry, normal totals. |
| Dec 31, 2021 | 50.2 | Started slow but made up in the fall. |
| Dec 31, 2020 | 42.45 | Below Average year |
| Dec 31, 2019 | 47.05 | Average year - cloudy December |
| Dec 31, 2018 | 65.67 | "Stormy" year |
| Dec 31, 2017 | 46.195 | About average year - cloudy December |
| Dec 31, 2016 | 33.60 | Lowest total recorded (beats 2001) |
| Dec 31, 2015 | 44.39 | Average Rainfall, Warm December, Strong El Nino |
| Dec 31, 2014 | 40.29 | Lower Rainfall this year. |
| Dec 31, 2013 | 48.34 | Average looking year total rainfall. |
| Dec 31, 2012 | 42.28 | Hurricane Sandy missed us with her load of rain. |
| Dec 31, 2011 | 78.72 | 2 Hurricanes 8 inches of rain each made for a record year. |
| Dec 31, 2010 | 47.57 | |
| Dec 31, 2009 | 48.05 | |
| Dec 31, 2008 | 52.76 | |
| Dec 31, 2007 | 46.51 | |
| Dec 30, 2006 | 50.31 | |
| Dec 31, 2005 | 51.65 | Rainy October 27 Named Atlantic Storms |
| Dec 31, 2004 | 44.60 | |
| Dec 27, 2003 | 54.23 | |
| Dec 28, 2002 | 43.97 | |
| Dec 29, 2001 | 34.34 | One of the driest years |
| Sept 15, 2001 | 27.43 | Saturday after 9-11 (37th of year.) |
| Dec 30, 2000 | 53.9 | |
| Dec 25, 1999 | 47.68 | Good year for wine. |
| Dec 31, 1998 | 57.43 | El Nino Year |
| Dec 27, 1997 | 41.74 | |
| Dec 28, 1996 | 54.38 | |
| Dec 30, 1995 | 37.39 | |
| Dec 31, 1994 | 44.35 | |
| Dec 25, 1993 | 39.71 | |
| Dec 26, 1992 | 40.73 | |
| Dec 28, 1991 | 37.38 | |
| Dec 29, 1990 | 51.08 | |
| LINKS |
Send E-Mail Link

 Historic Rainfall Chart